Over the past week, much media space was devoted to discussions around the size of India’s economy relative to other economies of the world. These discussions were based on the new estimates of the Gross Domestic Product (GDP) of various countries for 2024 by the International Monetary Fund (IMF), and its annual projections from 2025 till 2030. As per these projections, India’s GDP in 2025 was likely to be $4,187.03 billion, which will be marginally higher than the GDP of Japan at $4,186.43 billion. Thus, in all probability, India will be the fourth largest economy of the world in 2025 after the U.S., China and Germany.
These discussions have stirred the political pot as well. Government sources attributed the improved rank to the leadership capabilities of the Prime Minister. It was also argued that India could grow to be the third largest economy of the world in 2028, and a high-income, developed country (viksit bharat) by 2047.
The many GDPs
The GDP of a country tells us very little about how its people live and work, how healthy or educated its people are, and how unequally its aggregate income is distributed. GDP estimates also miss out on measuring several crucial aspects of economic activity that are not covered by markets, such as the unpaid work of women. Hence, there have been repeated calls to revise national account systems, end the predominant use of GDP to assess everything, and use other indicators that allow us to study socio-economic achievements better. Yet, the dominant use of GDP has continued in global and domestic discourse.
In recent years, the politicisation of statistical systems has clouded any objective assessment of India’s economic status. The discussions around India’s rank in GDP size are just an example. Comparison of GDP sizes across countries is a complex effort. International organisations and economists have spent decades trying to perfect a robust methodology for these comparisons. Consequently, there is no single GDP estimate for countries. There are several GDP estimates based on different methodologies and units.
The methodology of estimating GDP in different countries is largely standardised even as there are variations in the quality of data collection. But these estimates are available only in the national currencies of each country. So, how does one compare the GDP size of India and, say, the U.S.? To compare, one needs the GDP estimates of all countries to be in one common unit. This common unit is the U.S. dollar.
On determining the GDP
But problems remain. There are two ways of converting a GDP estimate in a national currency to a GDP estimate in U.S. dollars. First, one may use market exchange rates from the foreign exchange markets. At the time of writing this article, one dollar was valued at ₹85.69. One may simply divide India’s nominal GDP by ₹85.69 to get a GDP estimate in U.S. dollars, and then repeat that for all other countries and rank them.
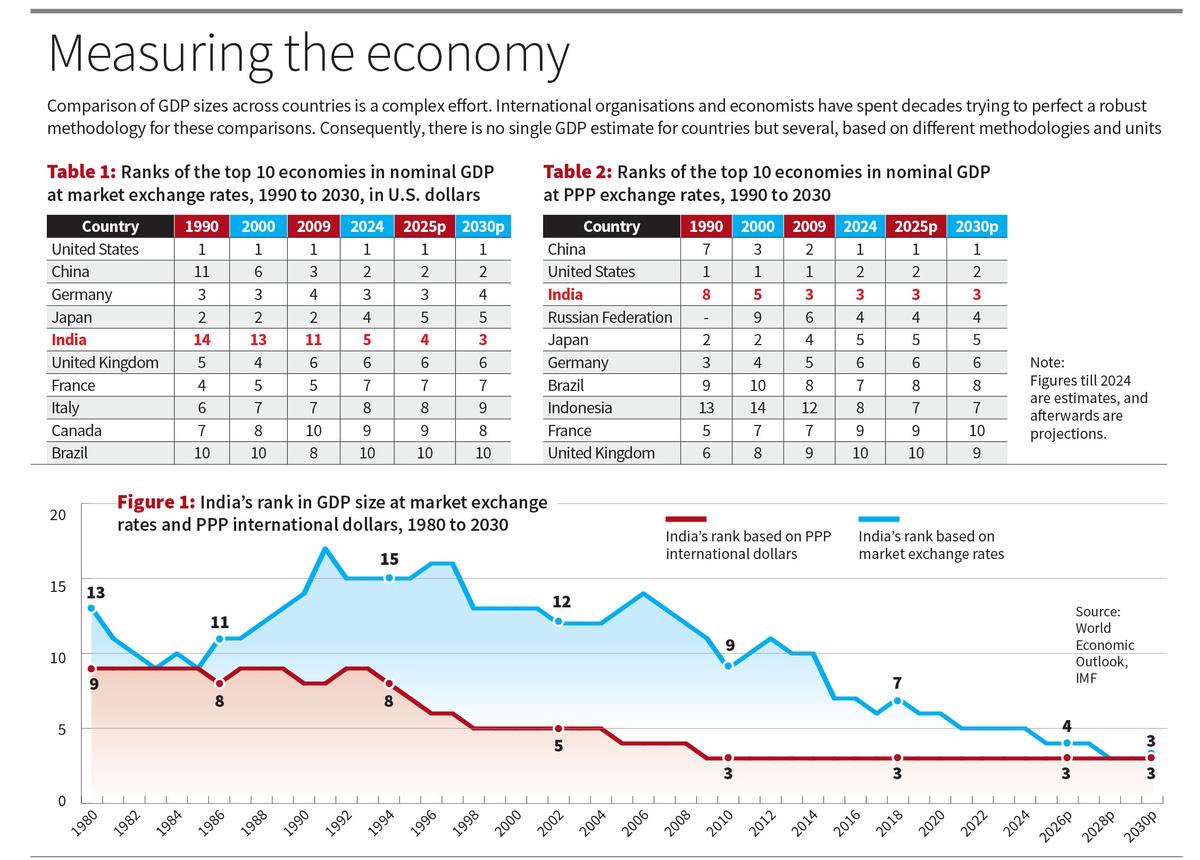
According to the GDP estimates based on market exchange rates, India was ranked the fifth largest economy from 2021 (Table 1 and Figure 1). Taken forward, the IMF projects that India will be the fourth largest economy in 2025 and the third largest economy in 2028. The U.S. is ranked first, and China is ranked second.
But is this the only method to compare GDP sizes? It is globally accepted that conversions based on market exchange rates are robust only when the outcomes are closely linked to the prevailing exchange rates. Transactions in the “current account” of an economy are a case in point, which involves the flow of financial resources across countries. For example, how much did each country export in value terms? How much remittances did international migrants from each country send back home?
The PPP comparison
When we try to compare GDP sizes across countries and time, market exchange rates deliver poorly. This is primarily because first, market exchange rates are highly volatile, which creates problems for stable temporal comparisons (see the fluctuations in Figure 1). Secondly, market exchange rates do not work well when “purchasing powers” of people are different between countries. For example, the price of a beer in New York may be $5 but only about ₹150 in Mumbai (or $1.80). The price of a Big Mac meal in McDonald’s may be $12 in New York but only about ₹385 (or $4.50) in Mumbai. Thirdly, the prices of non-traded goods tend to be far cheaper than traded goods in developing countries than in developed countries. For example, the monthly rent for a one-bedroom apartment may be about $4,000 in New York but only about ₹70,000 (or $824) in Mumbai. The price of a haircut in New York may be $30, but only about ₹200 (or $2.40) in Mumbai.
These differences across countries arise primarily because wages (and hence prices) are lower, and many non-traded sectors are labour-intensive, in developing countries than in the developed countries. If analysts ignore these differences, they will be underestimating the purchasing power of people in developing countries, and, hence, depressing their GDP estimates. This is why a second method is used to convert national currencies into dollars — ‘PPP exchange rates’, where PPP stands for Purchasing Power Parity. Here, the exchange rates used equate the cost of a “typical” basket of goods across countries. When converted to international dollars based on PPP exchange rates, the estimates of GDP for developing countries, where prices are relatively low, would rise. In 2024, the GDP of the U.S. was 7.5 times higher than India’s GDP if the market exchange rates method was used. But it was only 1.8 times higher than India’s GDP if the PPP exchange rates method was used.
If PPP-based GDP estimates are used to compare GDP sizes, an interesting finding emerges (see Table 2). India had already become the world’s third largest economy in 2009 and has retained that rank for the past 16 years (see Figure 1). Also, IMF’s PPP-based projections do not show any improvement in India’s rank between 2024 and 2030. It turns out that the government has chosen to project and celebrate India’s rank in GDP size based on market exchange rates — and not PPP exchange rates — only because the outcome suits its favoured political narrative.
Improving the comparisons
There is no doubt that the PPP method allows for a better comparison of GDP sizes than the market exchange rates method. However, the PPP method needs to be employed carefully so as to avoid misleading inferences. PPPs are used precisely because developing countries have lower wages, and hence lower prices and incomes, than in the developed countries. To cite an instance, about 76% of India’s casual workers in agriculture and about 70% of India’s casual workers in construction do not obtain even the prescribed minimum wages (as per ILO’s India Employment Report 2024). In addition, countries like India have a large informal sector, which is marked by severe underemployment, and large numbers of unpaid female workers.
In other words, the poorer and the more underdeveloped a country is, the larger will be its “inflation” of GDP via the PPP route. Consequently, the fact that India was the world’s third largest economy from 2009 itself must not delude anyone into believing that its GDP differentials with, say, the U.S. are rapidly narrowing, or that its GDP size is larger than that of Japan or Germany. An excellent example of such a misconception is the claim by Suman Berry, the Vice-Chairperson of the Niti Aayog, that India’s GDP has already reached $15,000 billion (or $15 trillion) in PPP terms, which is more than thrice its GDP size at market exchange rates and constitutes half the size of the U.S. GDP.
India has a large GDP size, but it is also host to the world’s largest population. One can boast about its GDP size only until someone sits down and divides the GDP by the population. The per capita GDP in India was $2,711 in 2024 in current dollar terms, which placed it at the lower end of the list of “lower middle-income countries”. In the same year, the per capita GDP in Sri Lanka was $4,325, and in Bhutan was $3,913. In 1991, India had a higher per capita GDP at $304 than in Vietnam at $141. But by 2024, Vietnam’s per capita GDP had grown to $4,536 while India’s per capita GDP languished at $2,711. In terms of market exchange rates, India’s rank in per capita GDP in 2024 was 144th among 196 countries. Even in terms of PPP international dollars, India’s rank in per capita GDP in 2024 was 127th among 196 countries. Either way, we are faced with a “big economy illusion”: India’s large GDP size has very little to do with the well-being of its people.
A much better way of knowing if India is more developed or less developed than the U.S., China, Japan or Germany might be to compare a set of indicators across them that help us meaningfully measure economic performance and social progress — indicators that signify fundamental elements of life and work that citizens care about.
R. Ramakumar teaches at the Tata Institute of Social Sciences, Mumbai.
Published – June 02, 2025 08:30 am IST